Air Quality Assessment in Selected Abattoirs in Makurdi, Benue State, Nigeria
*Correspondence
Ikwebe MosesEmail:
ikwebe.moses@uam.edu.ngAbstract
This study assesses air quality in selected abattoir sites in Makurdi, focusing on pollutant levels of nitrogen dioxide (NO₂), sulfur dioxide (SO₂), and carbon monoxide (CO) to evaluate their impact on local air quality. Data was collected from multiple sites during peak morning and evening periods and the mean concentrations of three air pollutants nitrogen dioxide (NO₂), sulfur dioxide (SO₂), and carbon monoxide (CO) was measured. Our findings revealed that pollutant concentrations, especially in the morning, consistently exceed WHO and Nigeria’s National Ambient Air Quality Standards (NAAQS). The levels of NO₂ (0.072 ± 0.052 ppm) and SO₂ (0.062 ± 0.059 ppm) were notably high at abattoir sites due to activities like waste burning, organic material combustion, and tire incineration. Similarly, CO with (4.618 ± 3.924 ppm) concentrations show marked morning spikes and sustained levels throughout the day, attributed to fuel combustion and vehicular exhaust emissions. The elevated levels of these pollutants at abattoir sites pose significant health risks to nearby populations, underlining the urgent need for targeted emissions control during peak operational hours. Without intervention, these sustained emissions will continue to degrade air quality, highlighting the critical need for regulatory measures to protect public health.
Keywords
Air Pollution, Abattoirs, Air quality impacts, Gasman Monitor, Health Effects.
Authors’ Contribution
IK designed the study; OT and TET contributed in writing; all authors revised the paper and approved for publishing.
Citation
Moses, I., Thomas, O., Terzungwe, T.E., 2025. Air Quality Assessment in Selected Abattoirs in Makurdi, Benue State, Nigeria. Adv. Environ. Soc. Sci., 1(1): 7-17.
Introduction
Air quality is a critical environmental and public health concern, particularly in urban areas where human activities, such as industrial processes and transportation, significantly impact atmospheric conditions (Iqbal, 2020; 2021; 2022). Abattoirs, as centers of livestock slaughter and meat processing (Vilallonga and Valcarcel, 2016; Dyab et al., 2019), contribute to air pollution due to the incineration of tyres and animal waste, use of fossil fuels, and poor waste management practices. These activities release harmful pollutants including carbon monoxide (CO), nitrogen dioxide (NO₂), sulfur dioxide (SO₂), and particulate matter, which can pose health risks to workers and nearby communities (Afolabi et al., 2019).
The World Health Organization (WHO) has established guidelines on permissible levels of these pollutants due to their adverse effects on respiratory health, ecosystem integrity, and overall well-being (WHO, 2018). However, many abattoirs in developing regions, including Nigeria, operate with limited regulation and inadequate waste disposal mechanisms, leading to elevated pollution levels (Emmanuel and John, 2019).
Makurdi, the capital of Benue State, hosts several abattoirs that serve the growing urban population. However, these facilities often operate with minimal environmental oversight. As a result, surrounding communities may be exposed to elevated levels of air pollutants, which have been linked to respiratory problems, eye irritation, and long-term cardiovascular diseases (Adewoyin et al., 2020; Akinbile et al., 2021). Despite the potential risks, few studies have focused specifically on the air quality impacts of abattoirs in Makurdi, creating a gap in local environmental health data. This assessment is particularly relevant due to the increasing urbanization in Makurdi and its potential to exacerbate pollution from abattoir operations (Akinbile et al., 2021).
In this study, the air quality around selected abattoirs in Makurdi was evaluated to determine the concentrations of CO, NO₂, and SO₂, comparing these levels with WHO and NAAQS standards.
Materials and Methods
Study area
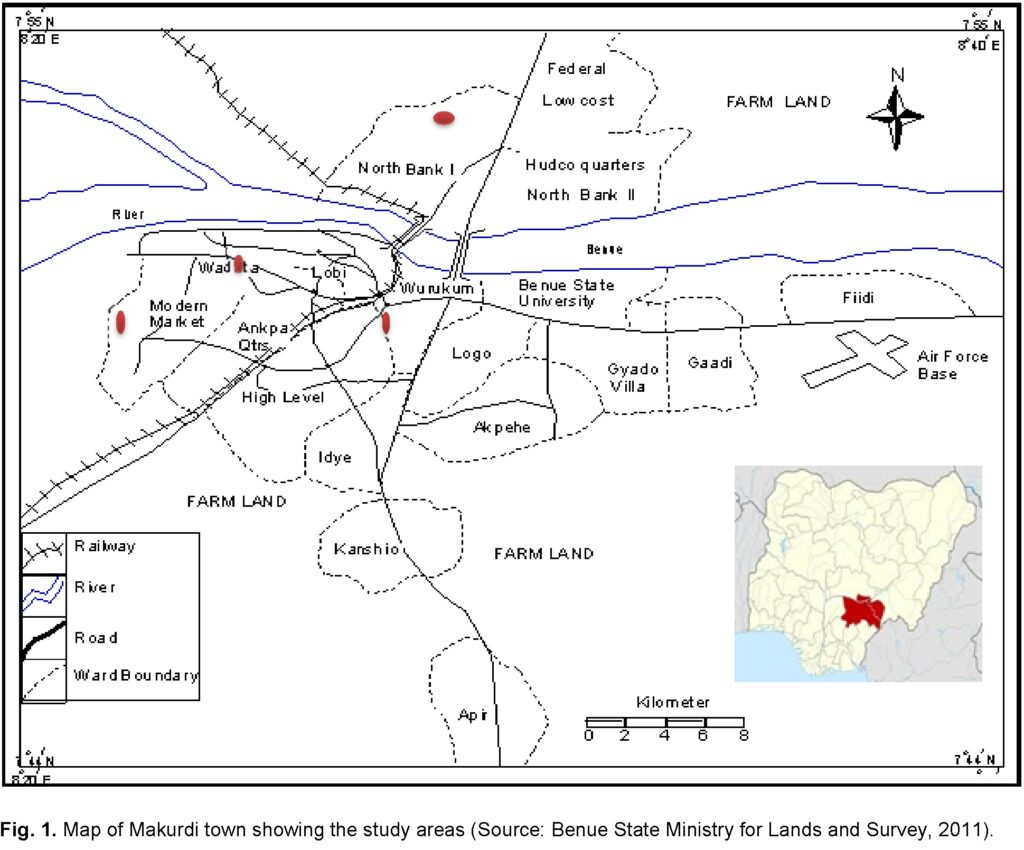
This study was carried out in Makurdi Town Makurdi Local Government Area (LGA) of Benue State (Figure 1). Apart from its status as the Headquarter of Makurdi LGA, Makurdi town also doubles as the state capital. Makurdi is located between longitude 8 o 35’E and 8 o 41’E and latitude 7 o 45’N and 9 o 52’N of the Equator. The River Benue divides the town into north and south Banks, which are connected by two bridges. The town is situated in a valley in north central Nigeria with an elevation of 100m above sea level. The current metro area population of Makurdi in 2024 is 472,000, a3.96% increase from 2023, and like any other urban city elsewhere among developing countries, it is faced with population growth and expansion of the town. Makurdi is a transit/nodal point (rail, road and in-land waterways) between the south-east and northern parts of Nigeria. The primary occupations of the traditional inhabitants of Makurdi were fishing and farming, and settlers’ civil servant and trading. The study region has experienced a rise in socioeconomic activities (Iortyom et al., 2020).
Materials
Hanhart Stopwatch model Mt 361, Crowcon gasman to detect carbon dioxide model number 19278 H, Crowcon gasman to detect nitrogen dioxide model number 19844 H, and Crowcon gasman to detect sulphur dioxide model number 19658 H.
Experimental Design
The experimental design involved sampling at two different sites within each of four distinct locations, with sampling occurring at two different times of the day (morning and evening), respectively.
Data Collection
Four locations and one sample site from each location were chosen within the metropolis as areas for the study. The location and their sites were; North Bank Abattoir, Wurukum Abattoir, Wadata Market Abattoir, and Modern Market Abattoir. A farm sites each for the four locations were used as control site, where there are no vehicular movements or commercial activities going on.
Samples were taken five days each for four different locations between 6:00 – 7:00 AM for abattoir, and 7:00-8:00AM for control site in the morning and between 4:00- 5:00PM in the control sites and 5:00-6:00PM for abattoir in the evening. For each of the pollutants at each site, samples were taken at interval of five minutes for a period of one hours for each site and a total of two hours for each location, a mean value of the morning and evening was then determined as the value of the pollutant observed for the particular day. The samples were taken for five days for each location within period of twenty days.
Procedure
The instrument was switched on to the test position. The light emitting diode (LED) flashed a red light continuously and an audible alarm sound was heard. The instrument was then switched to the gas position and a green light was observed on the LED. The liquid crystal diode (LCD) displayed zero reading. The Hanhart Stopwatch model Mt 361 was then switched on and the readings were taken at intervals of 5 minutes for a period of one hour for each site to ensure a steady concentration of the gas (Gasman Operation Manual).
Statistical analysis
Analysis of Variance (ANOVA) was used to compare the mean of the pollutants across the various locations. Statistical significance was established at p˂0.05 and the Tukey’s HSD was used to separate the mean.
Results
The average concentration of pollutants across different locations
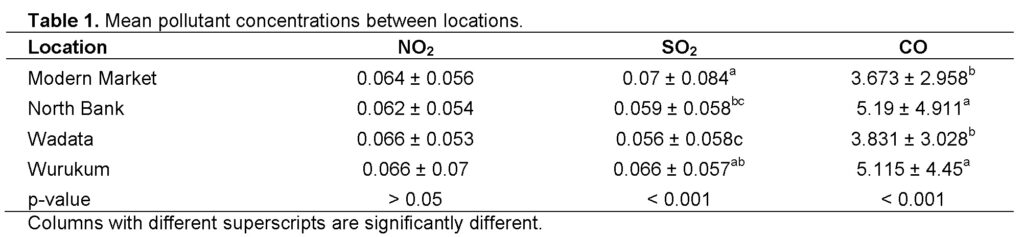
The mean concentration of three air pollutants nitrogen dioxide (NO₂), sulfur dioxide (SO₂), and carbon monoxide (CO) measured at four different locations: Modern Market, North Bank, Wadata, and Wurukum are shown in table 1.
Mean NO₂ concentrations across the four locations with mean values were ranging from 0.062 to 0.066 ppm. The NO₂ levels are consistent across with Modern Market (0.064 ± 0.056ppm), followed by North Bank (0.062 ± 0.054ppm), Wadata (0.066 ± 0.053ppm), and Wurukum (0.066 ± 0.07ppm). There were no statistically significant differences (p>0.05). This suggests that NO₂ pollution is evenly distributed among these sites.
Mean SO₂ concentrations vary significantly (p<0.001) between locations, with Modern Market showing the highest concentration (0.07 ppm),followed byWurukum (0.066 ± 0.057ppm), North Bank (0.059 ± 0.058ppm) and Wadata the lowest (0.056 ppm). CO concentrations showed a wide range across the locations, with North Bank and Wurukum having higher concentrations (5.19 ± 4.911 ppm and 5.115 ± 4.45 ppm, respectively) compared to Modern Market (3.673 ± 2.958ppm) and Wadata (3.831 ± 3.028ppm). These results indicated that North Bankand Wurukumhave significantly higher CO levels than Modern Market and Wadata. The p-value for CO is less than 0.001, indicating statistically significant differences in CO concentrations between the locations.
The average concentration of pollutants across the study sites
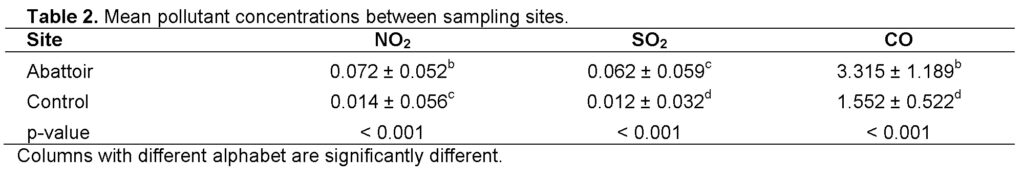
The results of daily variation in the concentration of NO2, SO2 and CO in the sites presented in Table 2 summaries the concentration of the air pollutants in abattoir and control. Abattoir (0.072 ± 0.052ppm) showed the highest NO2 level, significantly higher than the control (0.014 ± 0.056ppm). The SO2 level at abattoir (0.062 ± 0.059ppm) was significantly higher than control (0.012 ± 0.032ppm). Similarly the concentration of CO at abattoir (3.315 ± 1.189ppm) was significantly higher than control (1.552 ± 0.522ppm).
The average daily concentrations of pollutants at different times of the day (Morning and Evening)
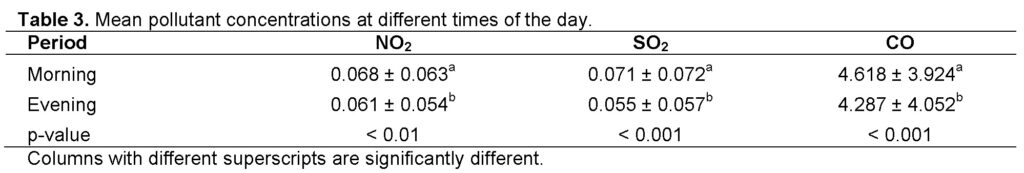
The concentrations of NO2, SO2 and CO at two different times of the day are shown in table 3. The results were the average of the data collected in the morning and evening respectively from the locations monitored during the study. Each column represented twenty days air quality data result. It showed the variation pattern for each pollutant measured across the study area at different times of the day. Mean NO₂ concentrations vary significantly (p<0.001) between different times of the day (morning and evening). Morning (0.068 ± 0.063ppm) showed higher NO2 levels compared to Evening (0.061 ± 0.054ppm). Mean SO₂ concentrations vary significantly (p<0.001) between morning (0.071 ± 0.072ppm) and evening (0.055 ± 0.057ppm). Similarly mean CO concentrations vary significantly (p<0.001) between morning (4.618 ± 3.924ppm) and evening (4.287 ± 4.052 ppm). Superscripts indicate that CO levels are significantly higher in the morning than in the evening (Table 3).
Pollutant Variation in Concentrations between Location and Sites
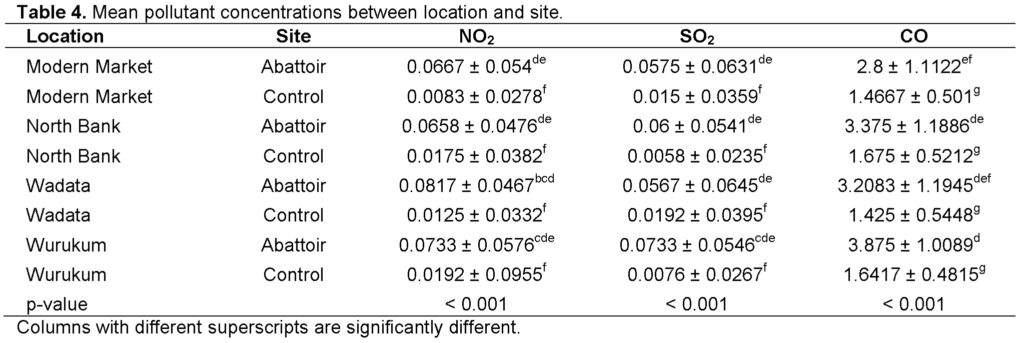
Table 4 presents the mean concentrations of three key pollutants NO₂ (Nitrogen Dioxide), SO₂ (Sulfur Dioxide), and CO (Carbon Monoxide) at two sites: Abattoir and Control, across four different locations in Makurdi: Modern Market, North Bank, Wadata, and Wurukum.
Mean NO₂ concentrations vary significantly (p<0.001) between abattoir and control, with higher NO₂ concentrations at Wadata Abattoir (0.0817 ± 0.0467), followed by Wurukum Abattoir (0.0733 ± 0.0576). Lowest at all the control sites with Modern Market Control (0.0083 ± 0.0278).
Mean SO₂ concentrations vary significantly (p<0.001) between abattoir and control, with higher SO₂ concentrations at Wurukum Abattoir (0.0733 ± 0.0546). All Control sites showed much lower values, indicating significantly lower concentrations of SO₂ compared to the abattoir sites. Mean CO concentrations vary significantly (p<0.001) between abattoir and control, with higher CO concentrations at Wurukum Abattoir (3.875 ± 1.0089), followed closely by North Bank Abattoir (3.375 ± 1.1886). The Control sites exhibited much lower concentrations, with the lowest recorded at Wadata Control (1.425 ± 0.5448).
Pollutant variation in concentrations across locations and different times of the day
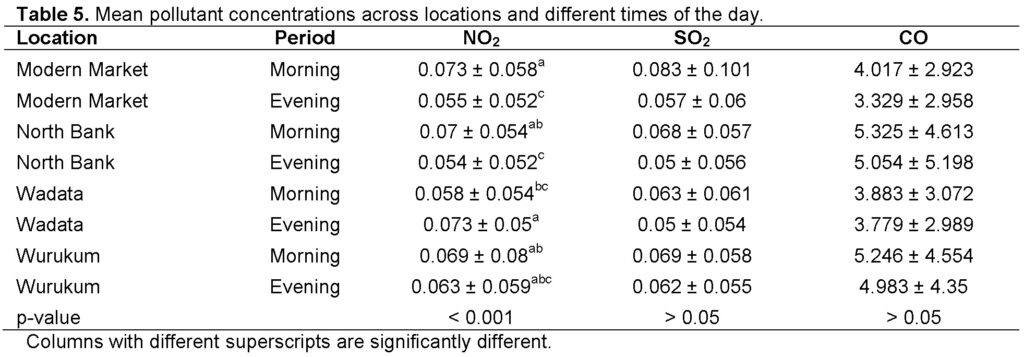
The data obtained in this research work for gaseous emission were calculated by Variation in concentration of nitrogen dioxide (NO2), sulphur dioxide (SO2) and carbon monoxide (CO) obtained at different locations (Wadata, Modern Market, Wurukum , and North Bank) and for different sampling periods (morning and evening), respectively are shown in table 5.
There were significant differences in NO2 levels between morning and evening across the locations. Morningconcentrations were generally higher compared to Eveningfor most locations. Modern Market and Wadata showed significant differences in NO2 levels between periods. Modern Market (0.073 ± 0.058ppm) and Wadata (0.058 ± 0.054ppm) both have higher NO2 in the morning compared to the evening (0.055 ± 0.052ppm) and (0.073 ± 0.05ppm) respectively, while North Bank and Wurukum also showed similar patterns but with less pronounced differences.
For sulphur dioxide (SO2), its concentrations ranged from the highest (0.083 ± 0.101ppm) in the morning at Modern Market and least concentration (0.063 ± 0.061ppm) in the morning at Wadata. The levels of SO2 with a considerable concentration (0.062 ± 0.055ppm) in the evening at Wurukum and least concentration (0.05 ± 0.054ppm) in the evening at Wadata. There are no statistically significant differences in SO2 levels between morning and evening across all locations. CO concentrations ranged from moderate (5.325 ± 4.613ppm) in the morning at North Bank and least concentration (3.883 ± 3.072ppm) in the morning at Wadata and CO highest concentration (5.054 ± 5.198ppm) in the evening at North Bank and least concentration (3.329 ± 2.958ppm) in the evening at Wadata. There are no statistically significant differences in CO levels between morning and evening across all locations. CO concentrations show variability within locations but no significant overall trend between the two periods. The values were below the Nigerian Air quality standard which stipulates a range of 09 ppm for a 24-hour range time for CO, 0.06 and 0.11ppm for SO2 and 0.1 ppm for NO2.
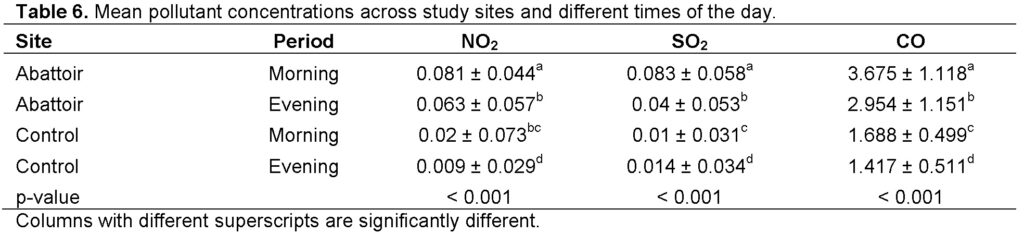
Mean pollutant concentrations across study sites and different times of the day
Table 6 presents the mean concentrationsof three air pollutants Nitrogen Dioxide (NO₂), Sulfur Dioxide (SO₂), and Carbon Monoxide (CO) measured at two different locations (Abattoir and Control) during two periods (Morning and Evening).
Mean NO₂ concentrations vary significantly (p<0.001) between abattoir and control, with higher NO₂ concentrations at abattoir in the morning (0.081 ± 0.044 ppm) and lower in the evening (0.063 ± 0.057 ppm). Control NO₂ levels are significantly lower, with morning readings (0.02 ± 0.073 ppm) and the lowest recorded in the evening (0.009 ± 0.029 ppm).
SO₂ concentrations at the Abattoir were notably higher in the morning (0.083 ± 0.058 ppm) and reduce in the evening (0.04 ± 0.053 ppm). Control with lower levels of SO₂ were observed, with the morning value at (0.01 ± 0.031 ppm) and evening at (0.014 ± 0.034 ppm). CO concentrations at the abattoir were also higher in the morning (3.675 ± 1.118 ppm) than in the evening (2.954 ± 1.151 ppm). Control, lower CO concentrations were recorded at this site, with morning (1.688 ± 0.499 ppm) and evening (1.417 ± 0.511 ppm) values significantly lower than those at the Abattoir.
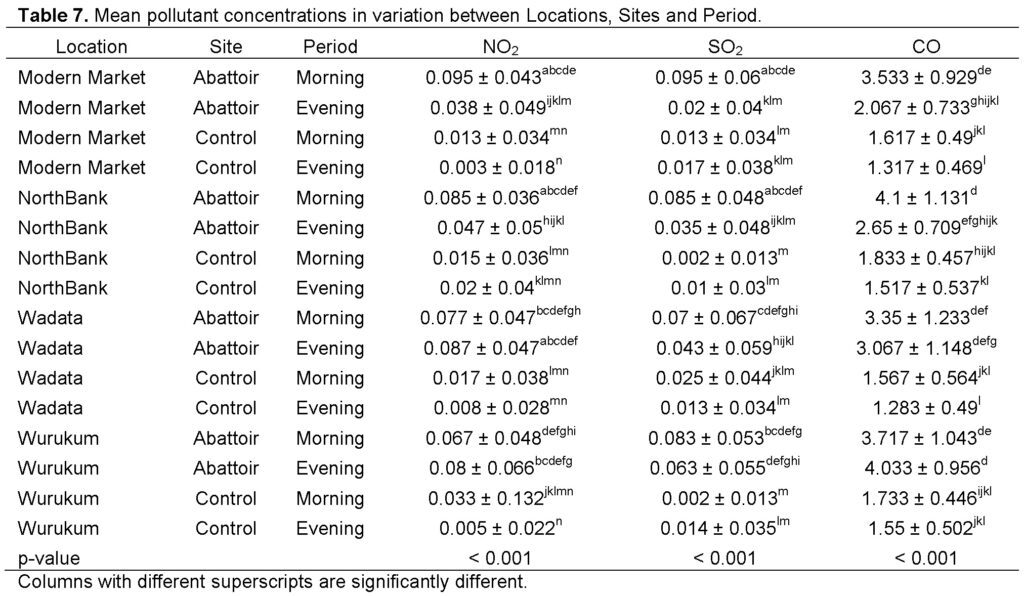
Variation in pollutants concentrations between location, study site and period
Table 7 presents the mean concentrations of three air pollutants Nitrogen Dioxide (NO₂), Sulfur Dioxide (SO₂), and Carbon Monoxide (CO) measured across four different locations (Modern Market, NorthBank, Wadata, and Wurukum), at two sites (Abattoir and Control), during two periods of the day (Morning and Evening).
Nitrogen Dioxide (NO₂) concentration at Modern Market with the Abattoir site shows the highest NO₂ concentration in the morning (0.095 ± 0.043 ppm), decreasing significantly in the evening (0.038 ± 0.049 ppm). The Control site has lower NO₂ levels, with morning and evening concentrations of (0.013 ± 0.034 ppm) and (0.003 ± 0.018 ppm) respectively. North Bank NO₂ levels are higher at the Abattoir site in the morning (0.085 ± 0.036 ppm) and decrease in the evening (0.047 ± 0.05 ppm). The Control site shows lower concentrations. At Wadata, the Abattoir site has elevated NO₂ in both morning (0.077 ± 0.047 ppm) and evening (0.087 ± 0.047 ppm), reflecting sustained emissions, potentially from continuous activities. And also at Wurukum, similar patterns are observed, with higher NO₂ levels at the Abattoir site in both periods compared to the Control site. Overall, NO₂ levels are highest at the Abattoir sites across all locations, particularly in the morning, which may be attributed to intensified emissions from morning activities at these sites.
Sulfur Dioxide (SO₂) concentration at Modern Market, with the highest in the morning at the Abattoir site (0.095 ± 0.06 ppm) and decreases in the evening (0.02 ± 0.04 ppm). The Control site maintains low levels in both periods. North Bank, higher SO₂ concentrations are recorded in the morning at the Abattoir site (0.085 ± 0.048 ppm), with a drop in the evening (0.035 ± 0.048 ppm). Wadata and Wurukum, elevated SO₂ levels are also recorded at the Abattoir sites in both periods, with higher concentrations in the morning. These findings suggest higher SO₂ emissions at Abattoir sites in the mornings across all locations, likely due to activities involving combustion, which is reduced by the evening. Carbon Monoxide (CO) concentration at Modern Market is highest in the morning at the Abattoir site (3.533 ± 0.929 ppm) and significantly decreases by evening (2.067 ± 0.733 ppm). The Control site shows consistently lower CO levels. North Bank and Wurukum CO levels are elevated in the morning and remain relatively high in the evening, with some of the highest concentrations seen at Wurukum Abattoir in the evening (4.033 ± 0.956 ppm). With Wadata Abattoir CO levels are similar in both periods but slightly higher in the morning. CO concentrations are highest at the Abattoir sites across all locations, especially in the morning, reflecting increased emissions possibly due to fuel combustion or vehicle exhaust.
Discussion
The study revealed that there were elevated levels of NO₂ at abattoir sites, especially in the morning, suggest intensive pollutant emissions during peak operational hours. For instance, at the Modern Market site, the NO₂ morning concentration (0.095 ± 0.043 ppm) surpasses recommended safety levels, aligning with observations by Musa et al. (2023), both the WHO 24-hour mean limit of 0.021 ppm and the NAAQS (Nigeria’s national standard) of 0.04 ppm (NESREA, 2020; WHO, 2021). The consistently elevated morning NO₂ levels across sites reflect heightened emissions from morning activities like waste burning and transportation, corroborating studies by Afolabi et al. (2022) and Musa et al. (2023), who found morning peaks in NO₂ levels due to urban activity.
Similarly, SO₂ levels showed a notable morning concentration spike, with the Modern Market abattoir site reaching 0.095 ppm, far above the WHO guideline of 0.02 ppm for a 24-hour period (WHO, 2021). The heightened levels in the morning likely stem from combustion activities associated with abattoir operations and tyres incineration, which aligns with previous findings that abattoirs are significant SO₂ emission sources in urban settings (Adamu et al., 2023). Although evening SO₂ levels are generally lower, abattoir sites still record higher SO₂ concentrations compared to control sites, indicating that emissions persist throughout the day but are less intense. Such findings underscore the influence of abattoir operations on air quality and resonate with the study by Ogunsola et al. (2021), which highlights combustion-based emissions as a significant SO₂ source in similar urban contexts. CO concentrations also reflect a marked increase in the morning across abattoir sites, with the highest levels observed at Wurukum in the evening (4.033 ± 0.956 ppm), potentially due to prolonged combustion and vehicular exhaust emissions. The persistent elevation of CO levels at abattoir sites indicates a strong influence of vehicle and combustion-related activities (Zia, A., 2019; Ashraf and Iqbal, 2021; Jackson et al., 2024; Okafor et al., 2025). These findings are consistent with WHO (2021) air quality guidelines, which cite that CO levels above 0.5 ppm (for an 8-hour mean) are harmful, underscoring that values like those seen at Modern Market (3.533 ± 0.929 ppm in the morning) present significant health risks. These findings underscore the need for targeted air quality management interventions at abattoir sites, particularly during peak activity periods in the morning. Without intervention, the sustained emissions observed can continue to exceed national and international standards, posing health risks to nearby populations.
Conclusion
The study concludes that abattoir operations significantly contribute to elevated pollutant levels, particularly in the morning hours when activities are at their peak. Nitrogen dioxide (NO₂) levels consistently exceed both WHO and NAAQS safety thresholds across abattoir sites, especially in the morning, due to waste burning, transportation, and other intensive activities. Sulfur dioxide (SO₂) concentrations also surpass WHO guidelines, especially at abattoir sites, due to the combustion of organic materials and tire incineration. Although evening concentrations are generally lower, they remain higher than control sites, indicating a continuous, albeit reduced, pollutant output throughout the day. Carbon monoxide (CO) levels display a similar pattern, with notable morning spikes and persistently high values at abattoir sites, reflecting emissions from fuel combustion and vehicular exhaust. The sustained CO levels at Wurukum in the evening underscore the impact of prolonged abattoir and transportation activities on air quality.
Acknowledgment
The authors sincerely thank Joseph Sarwuan Tarka University, for providing the necessary facilities to complete this research.
Conflict of interest
Authors declare no conflict of interest.
References
Adamu, H.M., Musa, S.M., Bello, K.L., 2023. Emission of sulfur dioxide from abattoirs and its implications on air quality in Nigerian urban centers. Afr. J. Environ. Sci. Technol., 17(3): 89-97.
Adewoyin, K.A., Olofin, E.A., Salami, M.A., 2020. Environmental and healthimplications of air pollution from abattoir operations in Nigeria. Nig. J. Env. Sci. Tech., 4(2): 95–103. https://doi.org/10.36263/nijest.2020.02.004
Akinbile, C.O., Aladejana, J.A., Awotunde, J.M., 2021. Evaluation of air and water quality around major abattoirs in southwestern Nigeria. Environ. Sci. Pollut. Res., 28: 19803–19814. https://doi.org/10.1007/s11356-020-12049-7
Afolabi, A.S., Oyewole, S.A., Ajayi, O.O., 2019. Environmental health implications of abattoir operations in Ilorin, Nigeria. Environ. Monitor. Assess., 191(11): 1–10. https://doi.org/10.1007/s10661-019-7844-0
Afolabi, O.T., Olufemi, B.O., Abiodun, A.T., 2022. Impact of urban activities on ambient air quality in selected areas. J. Environ. Sci. Public Health., 6(2): 145-157.
Ashraf, A., Iqbal, M.N., 2021. Environmental and Human Health Implication of Oil Industry Pollution. PSM Biol. Res., 6(4): 130-132.
Benue State Ministry for Lands and Survey, 2011. Map of Makurdi town showing the study areas.
Dyab, A.K., Ahmed, H.A., Hefnawy, Y.A., Abdel Aziz, A.R., Gomaa, M.M., 2019. Prevalence of Tissue Parasites in Cattle and Buffaloes Slaughtered in El-Minia Governorate Abattoirs, Egypt. PSM Vet. Res., 4(2): 49-58.
Emmanuel, J.,John, O., 2019. Environmental impact of abattoirs in Nigeria. J. Urban. Reg. Plan., 8(3): 56-64.
Gasman Operation Manual. Crowcon Detection Instrument Ltd, England. (2021)
Iortyom, E.T., Semaka, J.T., Abawua, J.I., 2020. Spatial Expansion of Urban Activities and Agricultural Lands Encroachment in Makurdi Metropolis. Eur. J. Environ. Earth., 1(6): 1-6.
Iqbal, M.N., 2021. Smog and Respiratory Infections: Continuing Challenges. Int. J. Nanotechnol. Allied Sci., 5(2): 34-36.
Iqbal, M.N., 2020. Smog may be ‘Key Contributor’ to Spike in Covid-19 Cases and Deaths during Second Wave of the Pandemic. Int. J. Altern. Fuels. Energy., 4(2): 44-46.
Iqbal, M.N., 2022. Smog in Pakistan: Air Pollution and Respiratory Health Problems. PSM Biol. Res., 7(3): 114-6.
Jackson, E.R., Buba, F.N., Ibrahim, V.A,, Kopteer, E.P., Aniya, U., Tukur, K.A., Odeh, A.A,. Abdullahi, S.K., Ahmad, B., Hosea, J.A., John, J.A., 2024. Geospatial analysis of the impact of abattoir activities in Karu, Abuja, Nigeria. World J. Adv. Res. Rev., 23(02): 643–677.
Musa, A.R., Yahaya, M., Umar, Z.A., 2023. Diurnal variations in nitrogen dioxide levels in urban Nigeria and health implications. Int J Environ Res Public Health.,20(4): 501-509.
NESREA (National Environmental Standards and Regulations Enforcement Agency). (2020). National Ambient Air Quality Standards (NAAQS) for Nigeria. NESREA Guidelines.
Ogunsola, O.J., Ibrahim, S.Y., Olatunde, F., 2021. The role of abattoir operations in carbon monoxide and nitrogen dioxide emissions in West African cities. Environ. Health Saf. J., 15(2): 201-212.
Okafor, U.C., Nwobu, I.M., Ozuah, C.L., 2025. Evaluation of Microbial Contamination and Diversity in Raw Goat Meat from Selected Abattoirs in Awka, Nigeria. Trop. Environ. Biol. Technol., 3(1): 51-63.
Vilallonga, D., Valcarcel, F., 2016. Improving the Diagnosis of Bacterial Rejections in Ovine Abattoirs by the Use of Simple Protocols. PSM Vet. Res., 01(1): 01-07.
WHO. 2021. WHO global air quality guidelines: Particulate matter (PM2.5 and PM10), ozone, nitrogen dioxide, sulfur dioxide, and carbon monoxide. World Health Organization. Available at: https://www.who.int/publications/i/item/9789240034228
WHO. 2018. WHO global air quality guidelines 2018. World Health Organization. Zia, A., 2019. Urbanization: A Threat for Agriculture Industry. PSM Biol. Res., 4(4): 135-137.